FAQCommon questions
Why did gold fall to 3,757 on 18 November 2026?
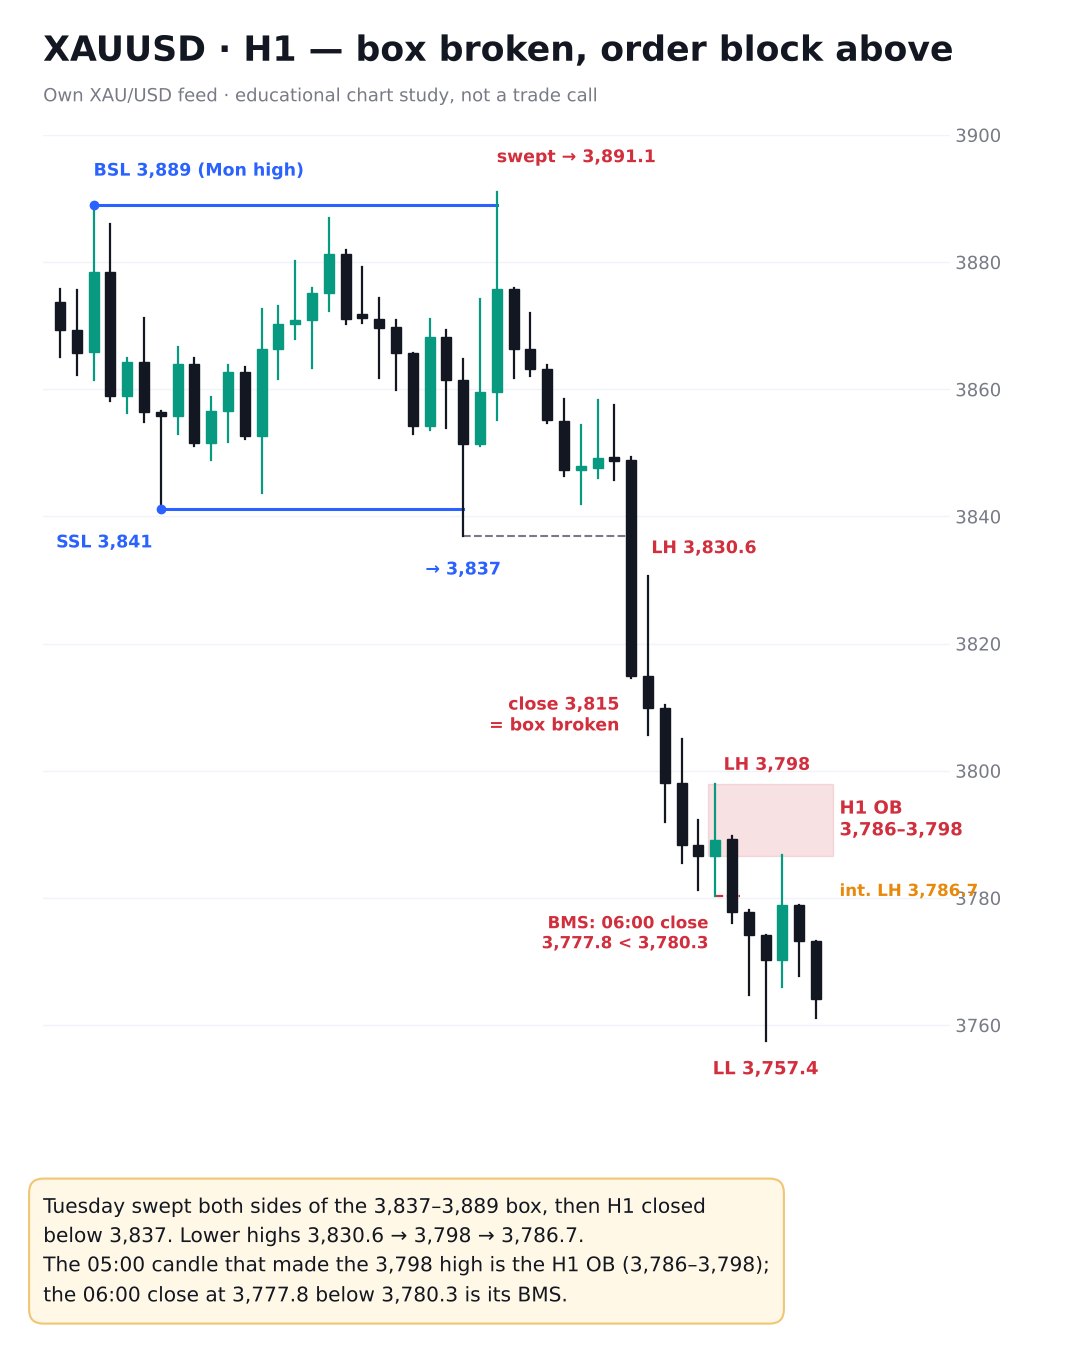
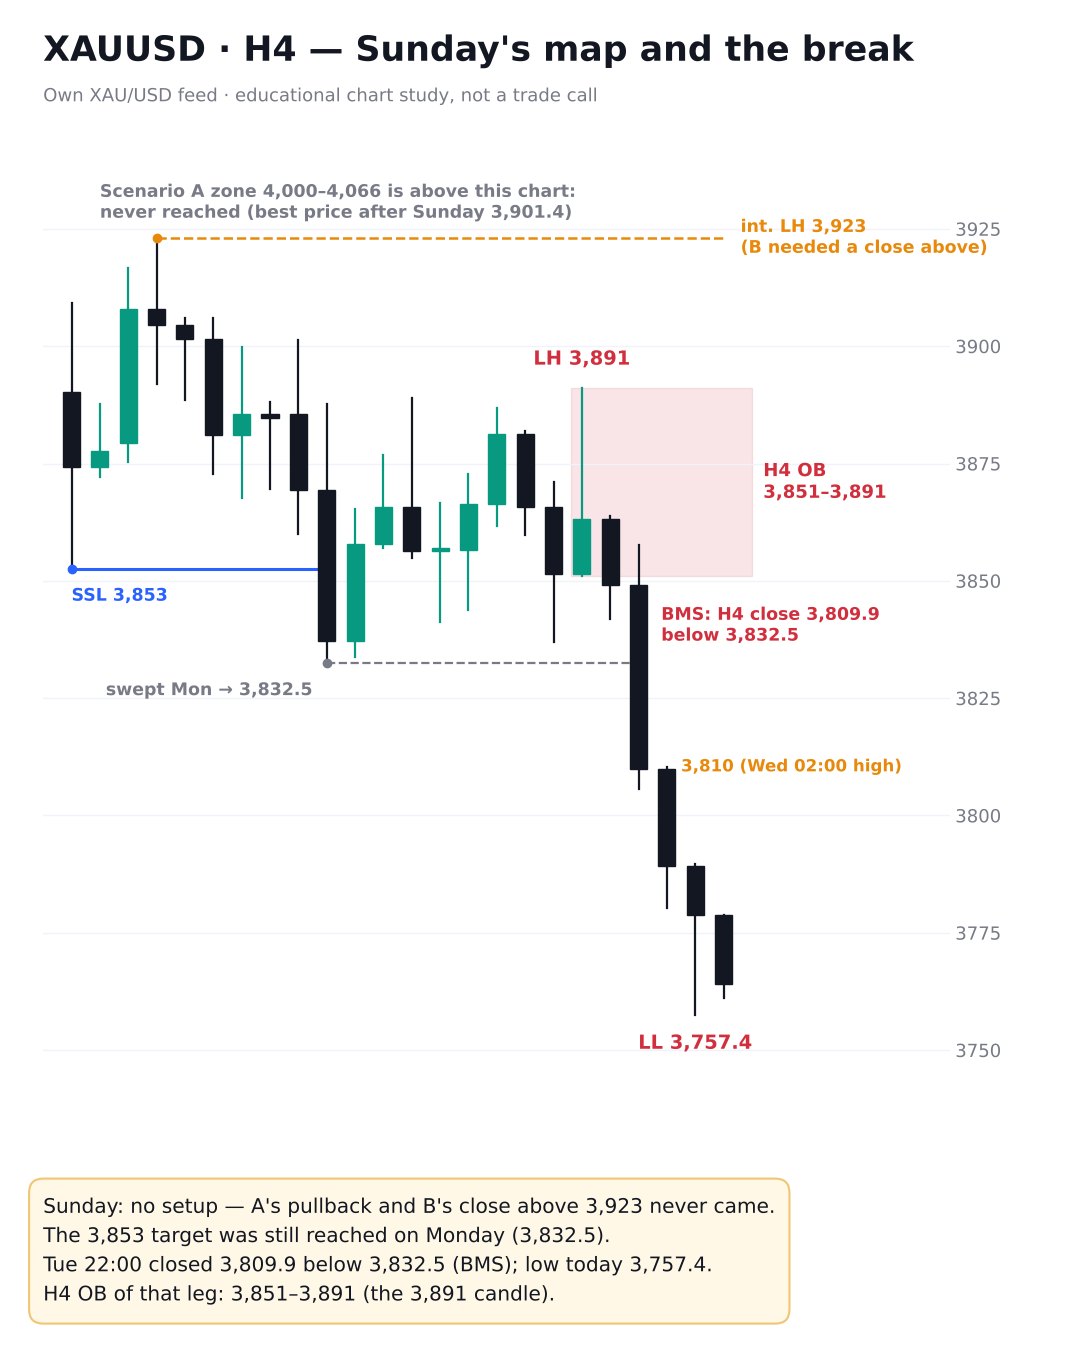
On the chart, Tuesday swept the buy-side liquidity above 3,889 (to 3,891.1), then price broke the 3,837 range low and the H4 candle closed below Monday's 3,832.5 low, a break of structure. On the news side, markets price a very high chance of a December Fed rate hike (above 90% on CME FedWatch, as reported by Trading Economics on 16–17 November) and the US dollar is near a 19-month high, both of which usually weigh on gold.
Is gold still bearish this week?
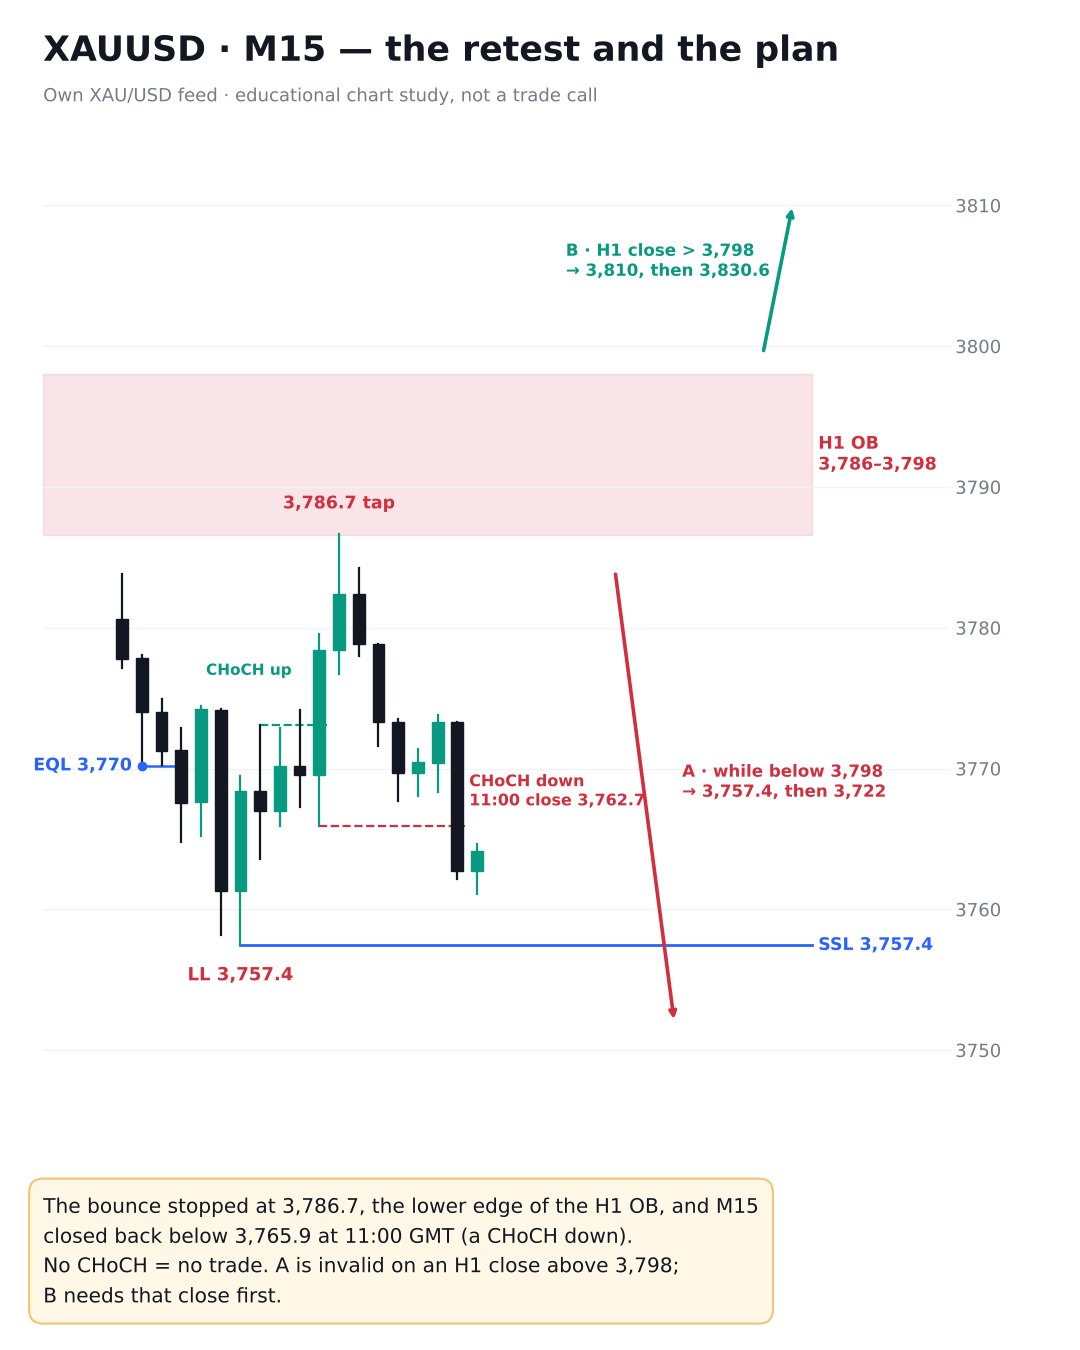
The structure is bearish on the daily, H4 and H1 charts: lower highs at 3,891, 3,830.6, 3,798 and 3,786.7, and a lower low at 3,757.4. The bearish read holds while H1 stays below 3,798. Only an H4 close above 3,891 would break the external bearish structure.
What are the key XAU/USD levels for the rest of the week?
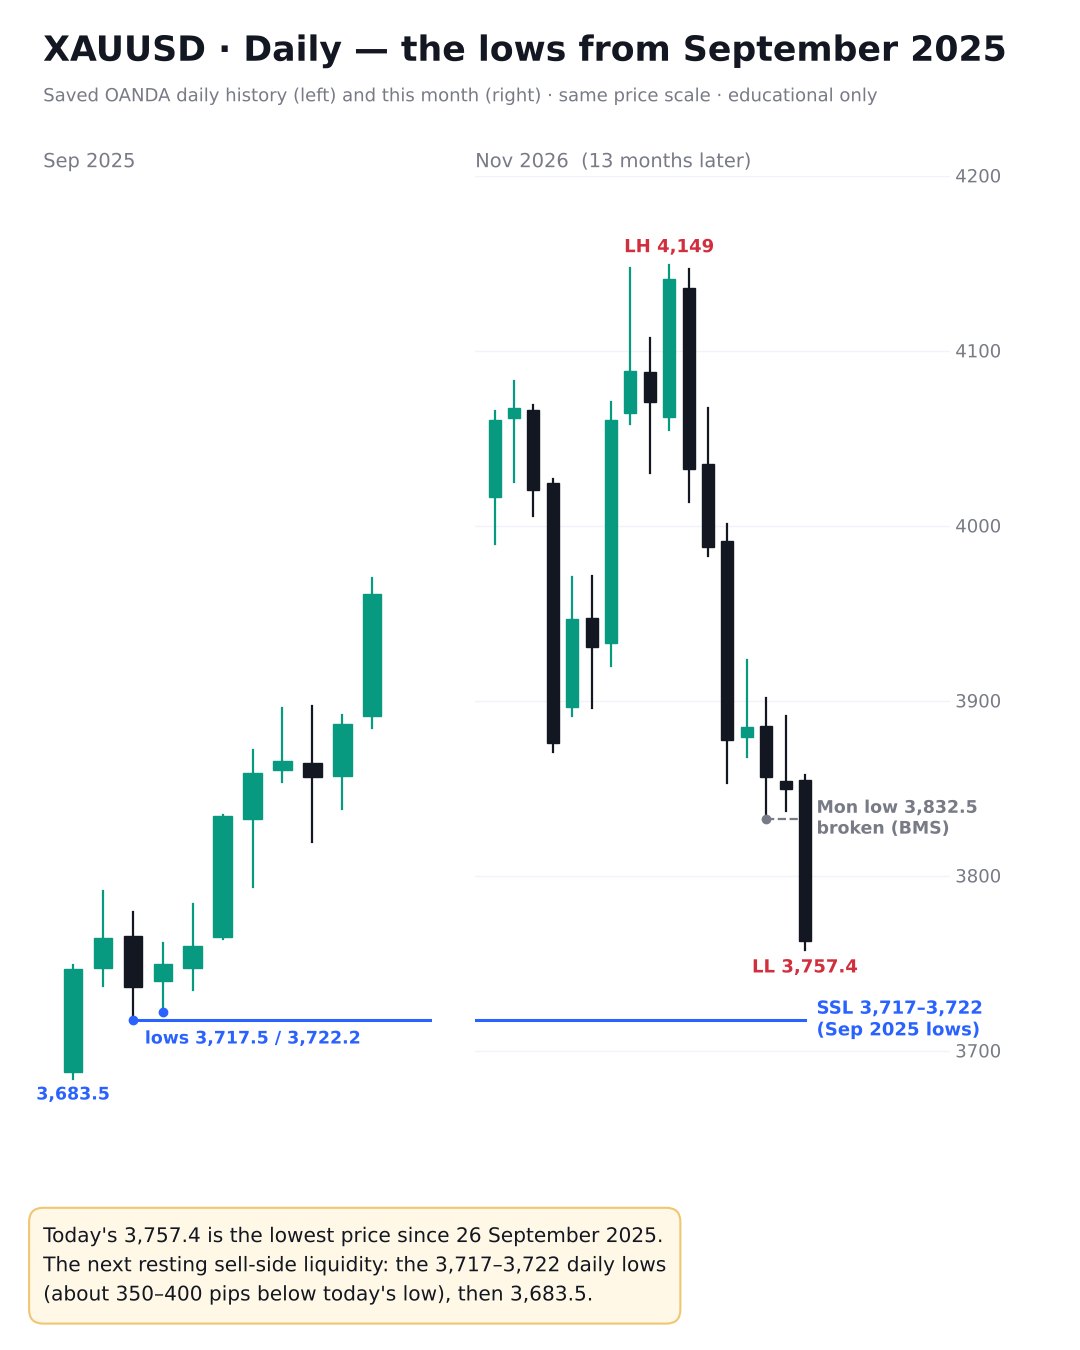
Above: the H1 order block at 3,786–3,798, then 3,810 and 3,830.6, and the H4 order block at 3,851–3,891. Below: 3,757.4 (today's low, sell-side liquidity), then the 3,717–3,722 lows from 24–25 September 2025, then 3,683.5.
What happened to Sunday's weekly plan?
Sunday's study had two scenarios. Scenario A waited for a pullback into 4,000–4,066; price never got above 3,901.4, so there was no setup. Scenario B needed an H4 close above 3,923; that never happened either. The downside target at 3,853 was still reached on Monday, when gold traded to 3,832.5, and price has since fallen to 3,757.4.
When are the FOMC minutes and what else is on the calendar?
The FOMC minutes are due on Wednesday 18 November at 19:00 GMT (00:00 Thursday, Pakistan time). Thursday brings US jobless claims and the Philly Fed index at 13:30 GMT (18:30 PKT). On Friday, Fed Governor Waller speaks at 13:25 GMT and the final University of Michigan sentiment survey is at 15:00 GMT (20:00 PKT).
Is this a trade signal?
No. This is an educational study of market structure and liquidity. It is not a trade call or a recommendation to buy or sell, and levels can change by the time you read this.