Skip to content
Structure research for goldH4 engine log head b3f5fb14…
Gold-focused researchLog in
XAU Setups
Weekly outlook · 15 November 2026

Gold weekly outlook: 3,853 below, 4,067 above.

Last week gold ran the 4,149 high, then fell 2,961 pips and took the October low, closing at 3,884.7. Here is the weekly gold outlook for 16–20 November: the monthly-to-H4 structure, the liquidity on both sides, two scenarios, and the news that can move price.

Educational chart analysis only · not financial advice.This is a study of market structure for learning. It is not a trade call or a recommendation to buy or sell. Prices move fast; levels can be invalid by the time you read this.
Review

What happened to the 12 November plan?

  • The plan was: wait for a pullback into the H4 order block at 4,045–4,067, then an M15 CHoCH down on a candle close.
  • The pullback never came. The highest price after the study was 4,000.7 (late 11 Nov), well below the zone.
  • The liquidity targets were all reached anyway: 3,918–3,920, 3,896 and the 3,870 October low, with a low at 3,852.6 on 12 Nov.
  • No pullback into the zone means no setup by our rules. The map was right about the direction; we still do not chase a move that skipped the zone.
  • 13 Nov (Core PPI map): the 3,887–3,890 equal lows were swept before the release and the first spike reversed inside the no-trade window, so again no entry. Buy-side liquidity at 3,923 and 3,955 is still untouched, and the 3,852.6 week low held into the close.
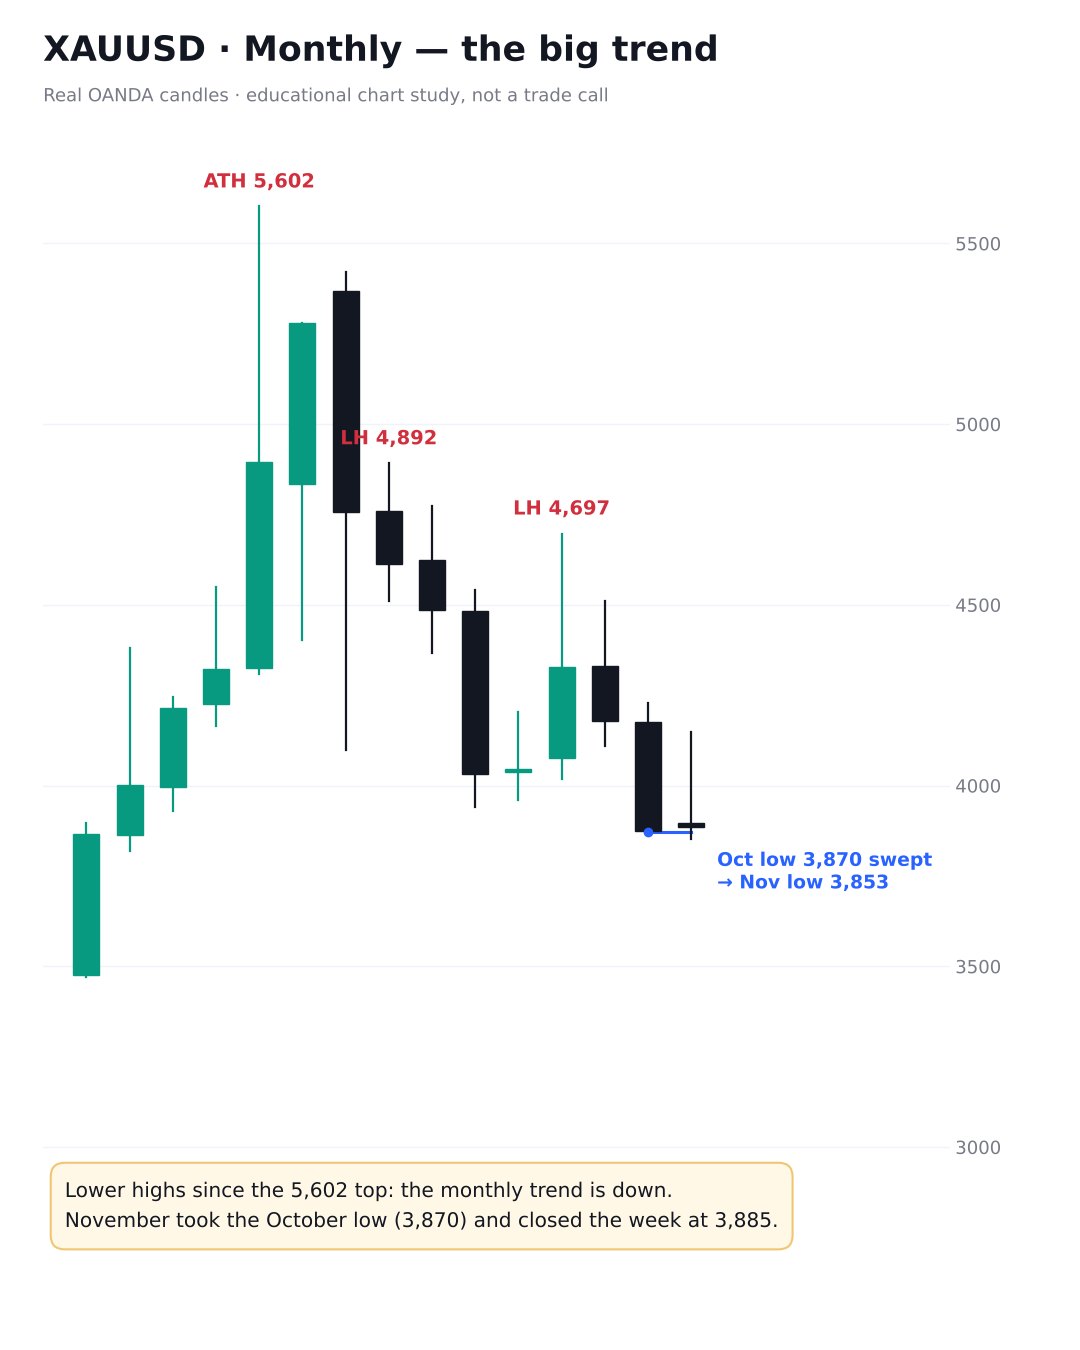
Monthly gold chart. All-time high 5,602 in January 2026, lower highs at 4,892 and 4,697, the October low of 3,870 swept in November to 3,853.
Step 1 · Monthly

What is the big trend?

  • Gold printed its highest high at 5,602 in January 2026.
  • Each high since then is lower: 4,892 in April and 4,697 in August.
  • November took the stops below the October low of 3,870 and traded to 3,853.
  • The week closed at 3,884.7, back above the October low.

What it means: The big trend is still down. A monthly close back under 3,870 would confirm the new low.

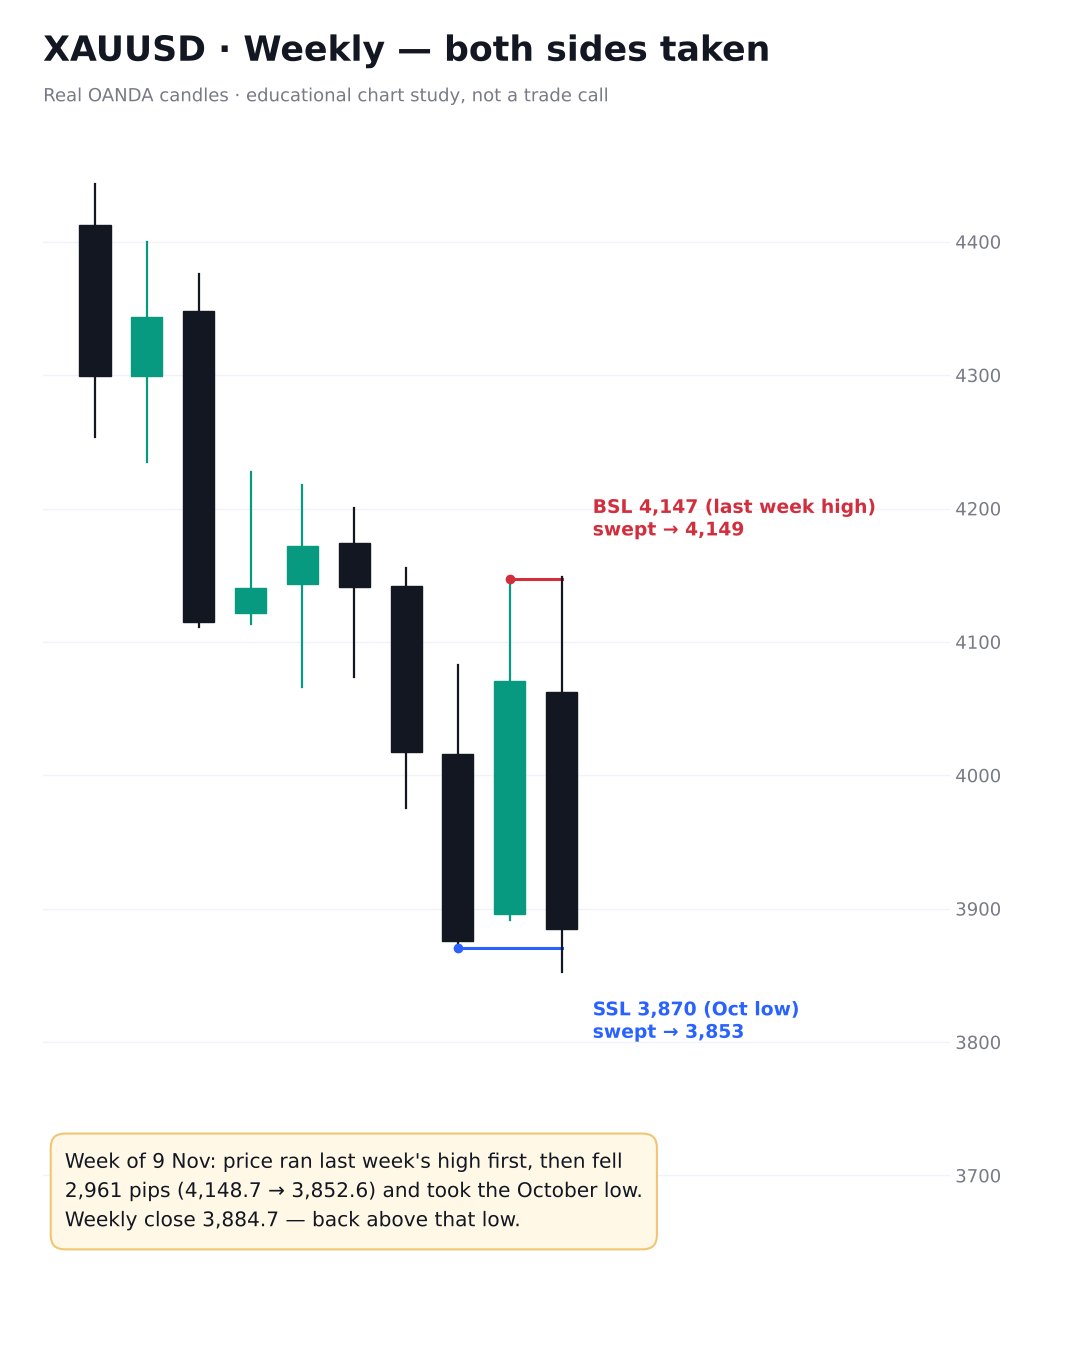
Weekly gold chart. The week of 9 November swept the prior week high at 4,147 to 4,149, then fell to 3,853 below the October low of 3,870, closing at 3,885.
Step 2 · Weekly

What did last week do?

  • Price first ran the previous week's high: 4,146.9 → 4,148.7 (buy-side liquidity).
  • Then it fell 2,961 pips (4,148.7 → 3,852.6) and took the October low at 3,870.3 (sell-side liquidity).
  • The weekly candle closed at 3,884.7, above that low.

What it means: Both sides of liquidity were taken in one week. The close above 3,870 means the low has not yet been accepted; the first days of this week decide that.

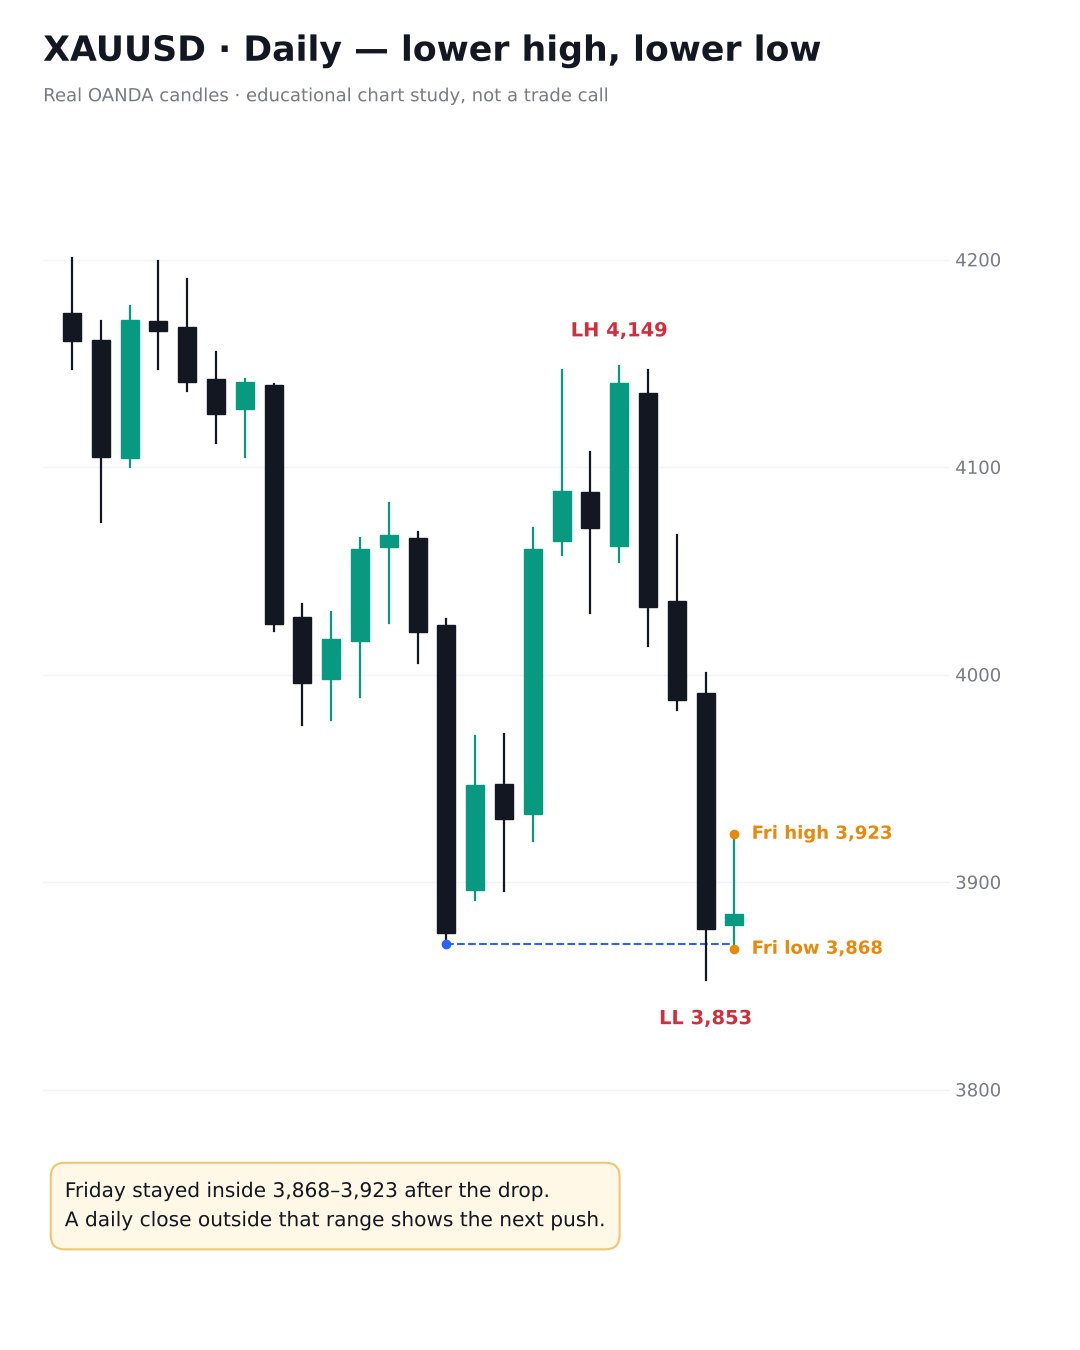
Daily gold chart. A lower high at 4,149, a lower low at 3,853, and Friday trading inside a 3,868 to 3,923 range.
Step 3 · Daily

Where does the daily stand?

  • Daily structure: lower high 4,149, lower low 3,853.
  • Friday stayed inside a 3,868–3,923 range after the drop.
  • A daily close above 3,923 or below 3,868 shows which side is in control next.

What it means: The daily trend is down. Friday's range is the first decision box of the week.

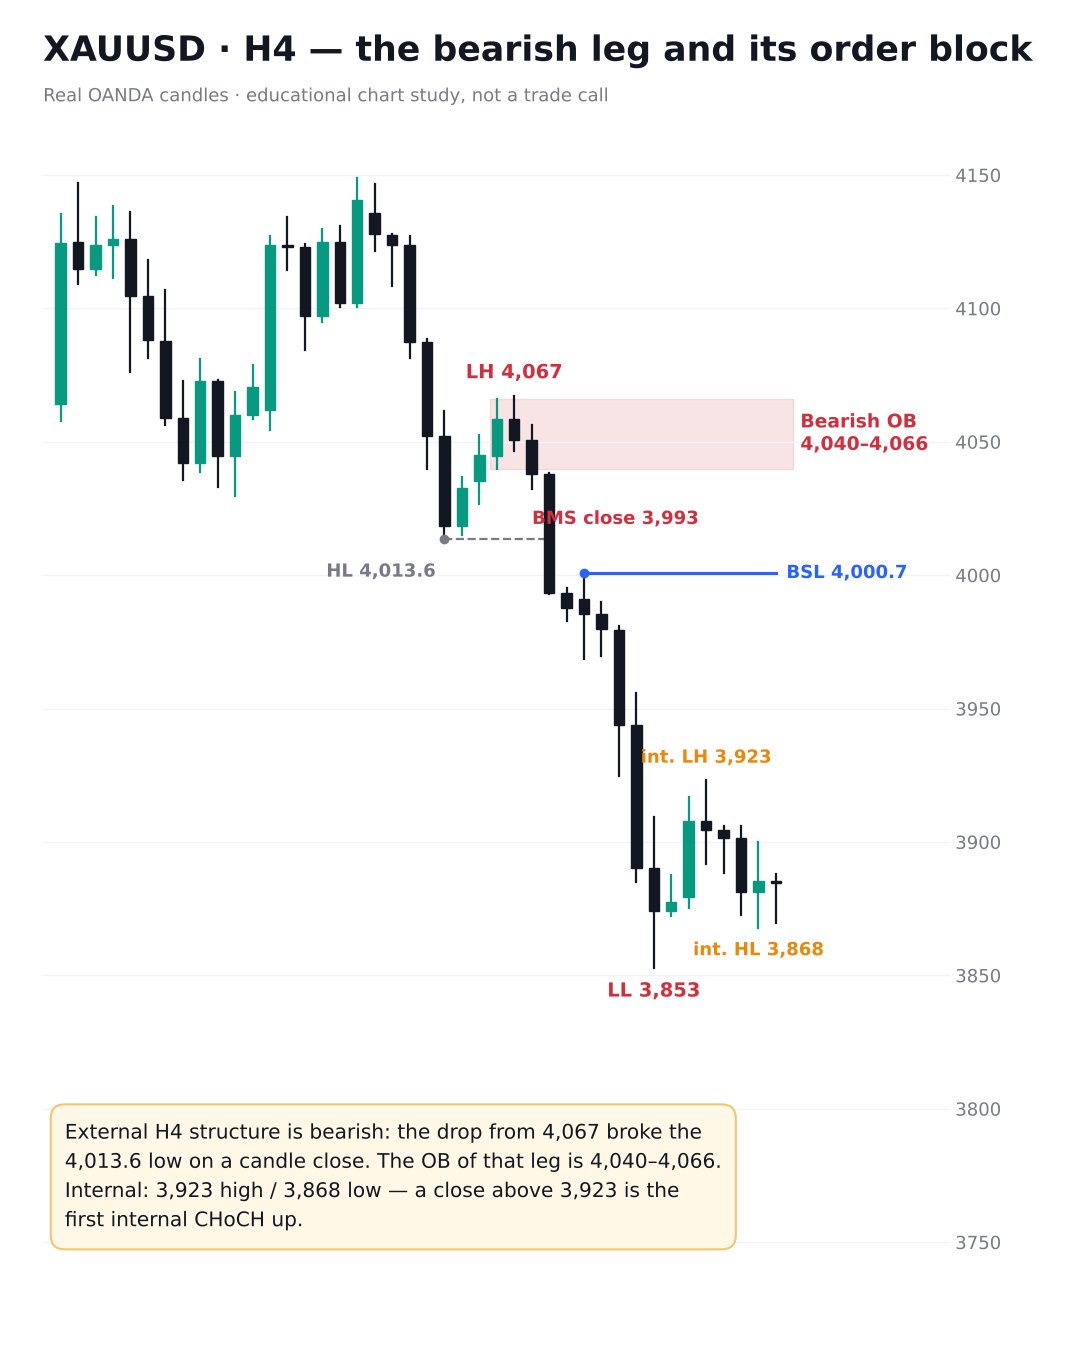
H4 gold chart. Lower high at 4,067, a candle close at 3,993 below the 4,013.6 low (break of structure), a bearish order block at 4,040 to 4,066, a lower low at 3,853, an internal lower high at 3,923 and an internal higher low at 3,868. Buy-side liquidity at 4,000.7.
Step 4 · H4 structure

What does H4 show?

  • External structure (bearish): lower high 4,067, then the 11 Nov 14:00 UTC candle closed at 3,993 below the 4,013.6 low: a break of structure.
  • The last up candle before that drop leaves a bearish order block at 4,040–4,066.
  • Internal structure: after the 3,853 low, price made an internal lower high at 3,923 and an internal higher low at 3,868.
  • Buy-side liquidity sits above 3,923, 3,955.8 and 4,000.7.

What it means: An H4 close above 3,923 would be the first internal CHoCH up (an internal target, not a trend change). Only a close above 4,067 breaks the external bearish structure.

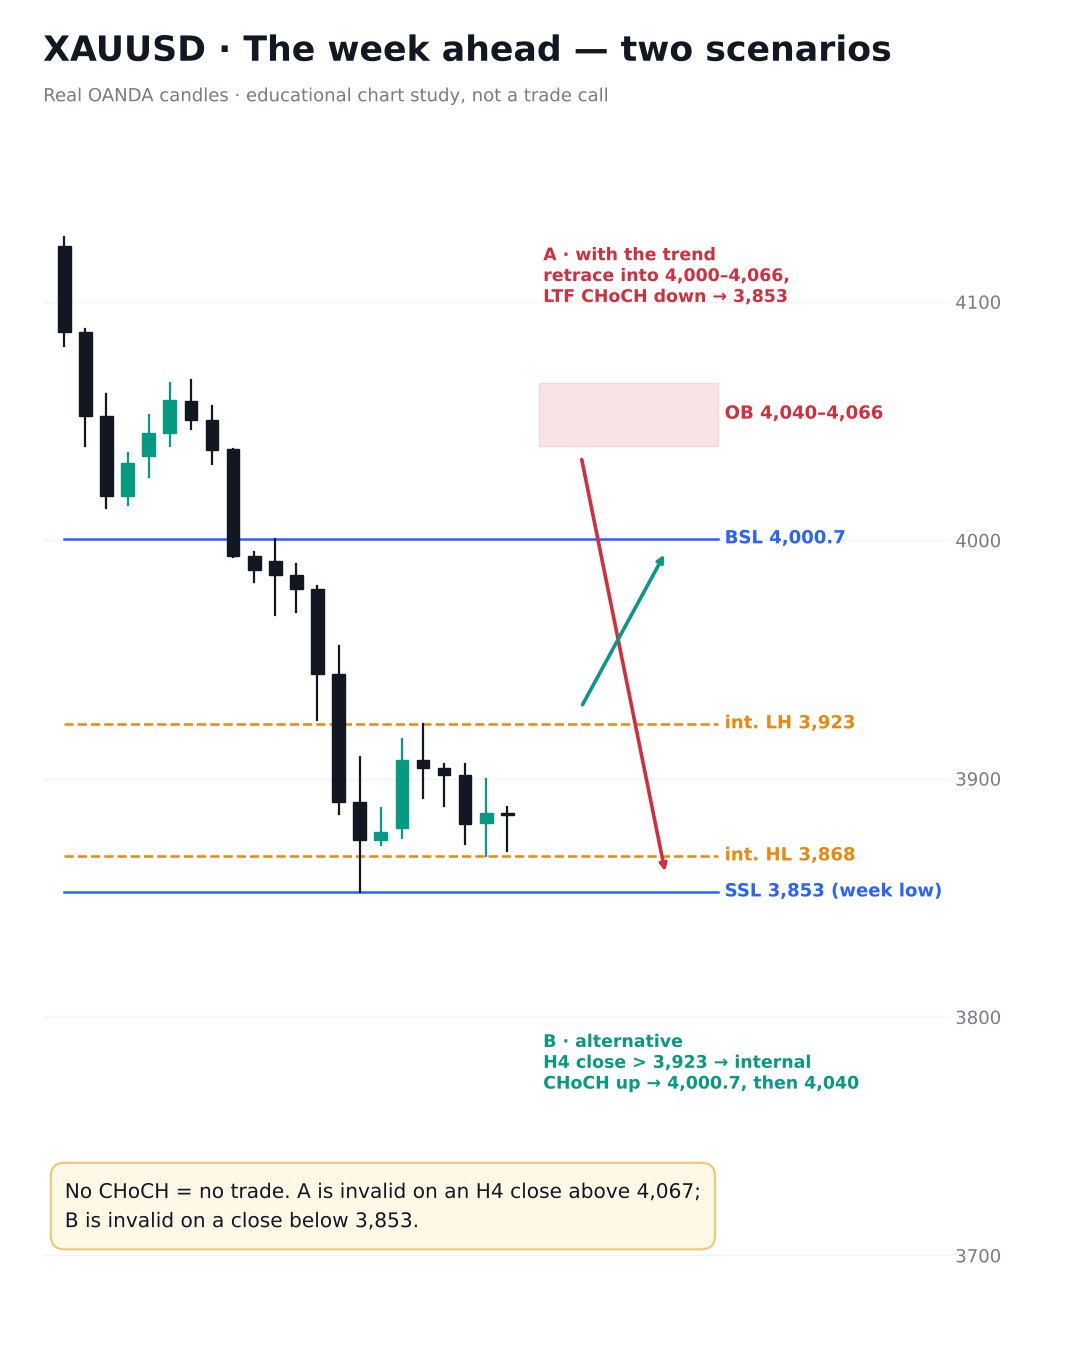
H4 plan chart. Scenario A: a pullback into 4,000 to 4,066 and a lower-timeframe CHoCH down toward 3,853. Scenario B: an H4 close above 3,923, an internal CHoCH up toward 4,000.7 and then 4,040.
Step 5 · Plan

What are the two scenarios?

  • Scenario A (with the trend): a pullback into 4,000–4,066 (buy-side liquidity, then the order block), then an M15/H1 CHoCH down on a candle close. The draw: 3,853 (about 1,480 pips from 4,000), then lower.
  • Scenario B (alternative): an H4 close above 3,923 gives an internal CHoCH up. The internal draw: 4,000.7, then the 4,040 order block, where sellers may defend.
  • Invalidation: A is cancelled by an H4 close above 4,067; B is cancelled by a close below 3,853.

What it means: Price at 3,885 sits between zones. Nothing to act on until it reaches a zone and confirms with a CHoCH.

Big news

This week's big news for gold

Last week's fall came with a hawkish Fed: Governor Waller said a December rate hike is warranted, and US core CPI printed 0.3% m/m on 10 November, above forecasts. Rate and dollar news therefore matters more than usual this week.

DayGMTPakistanEventWhy it matters for gold
Mon 16 Nov17:0022:00Fed Chair Kevin Warsh speaksAny hint on the size of a December hike can move the dollar and gold quickly.
Tue 17 Nov13:3018:30US retail sales (October)Strong spending supports more hikes (usually weighs on gold); weak spending can lift gold.
Wed 18 Nov19:0000:00 (Thu)FOMC minutes (27–28 Oct meeting)Shows how many officials want faster hikes. Hawkish minutes can push gold toward the lows.
Thu 19 Nov13:3018:30Philly Fed index + initial jobless claimsA quick read on the economy; surprises often cause a short spike.
  • No new entries 1 hour before and 45 minutes after each high-impact release.
  • Spreads widen around the news; stops can fill worse than planned.
  • Wait for the spike candle to close, then for a CHoCH in the zone, before reading any direction.
  • Reduce risk on news days.
Summary

What we are watching this week

Higher-timeframe trendDown on the monthly, weekly and daily
Last weekTook 4,149 (BSL) then 3,870 (SSL); low 3,853, close 3,884.7
H4 externalLower high 4,067, BMS below 4,013.6, OB 4,040–4,066
H4 internalLower high 3,923, higher low 3,868
Scenario APullback into 4,000–4,066 + LTF CHoCH down → 3,853
Scenario BH4 close above 3,923 → 4,000.7, then 4,040
InvalidationA: H4 close above 4,067 · B: close below 3,853
Big newsRetail sales Tue, FOMC minutes Wed night, claims Thu

No CHoCH means no setup. If price runs away without reaching a zone, we do not chase it.

FAQ

Common questions

Is gold bullish or bearish for the week of 16 November 2026?

The higher-timeframe structure is bearish: lower highs on the monthly chart since 5,602, a daily lower high at 4,149 and a lower low at 3,853. On H4 the drop from 4,067 broke the 4,013.6 low on a candle close. The bearish view holds while price stays below 4,067.

What are the key XAU/USD levels this week?

Above: 3,923 (Friday high and internal H4 lower high), 4,000.7 (buy-side liquidity), the 4,040–4,066 H4 bearish order block and 4,067 (invalidation of the bearish view). Below: 3,868 (Friday low) and 3,853 (last week's low, sell-side liquidity).

What happened to last week's plan?

The 12 November study waited for a pullback into the 4,045–4,067 order block. Price never got there (the best it did was 4,000.7), and it fell straight through the liquidity targets at 3,918–3,920, 3,896 and 3,870 to 3,853. With no pullback into the zone, there was no setup by our rules.

Which news can move gold this week?

US retail sales on Tuesday 17 November (13:30 GMT, 18:30 Pakistan time), the FOMC minutes on Wednesday 18 November (19:00 GMT, 00:00 Pakistan time on Thursday), and the Philly Fed index plus jobless claims on Thursday 19 November (13:30 GMT). Fed Chair Warsh speaks on Monday 16 November (17:00 GMT).

Is this a trade signal?

No. This is an educational study of market structure and liquidity. It is not a trade call or a recommendation to buy or sell, and levels can change by the time you read this.
Educational chart analysis only · not financial advice. This analysis is for education only. It is not a trade call, and past structure does not guarantee future price. Trading gold on margin carries a high risk of loss.

Update: Gold mid-week outlook, 18 November 2026 · Previous study: Gold multi-timeframe analysis, 12 November 2026

Tools & services

Check this on our own tools

Every level and term in this article can be followed on the tools we use ourselves. The map, the alerts and the Telegram channel are free. Paid products are for traders who want more, and you never need them to learn.

Free tool

Gold Liquidity Map

Where liquidity may rest above and below gold on the 1H, 4H and Daily charts, nearest first, in pips.

Open the mapHow to use it
Free tool

Liquidity Alerts

Each sweep, CHoCH and retest followed step by step, with the full history of confirmed and failed setups.

See the alerts
Free · Paid

Telegram community

Free channel: daily chart notes and new lessons. Premium Alerts (from $79 a month): Intraday, Swing or both packages in a private channel.

Join the free channel (opens in a new tab)About Premium Alerts
Paid software

Gold AI Engine

Software for your own MT4/MT5 account: signals, an auto-copier and Telegram alerts. Monthly or lifetime licence.

How it worksDaily activity log

Tools describe what price did; they do not predict it. Paid products are software and education, not investment advice or account management, and no result is promised. Trading gold on margin carries a high risk of loss.

Get new analysis in the free Telegram community.

New posts and market notes from our team, free.