FAQCommon questions
Is gold bullish or bearish today (12 November 2026)?
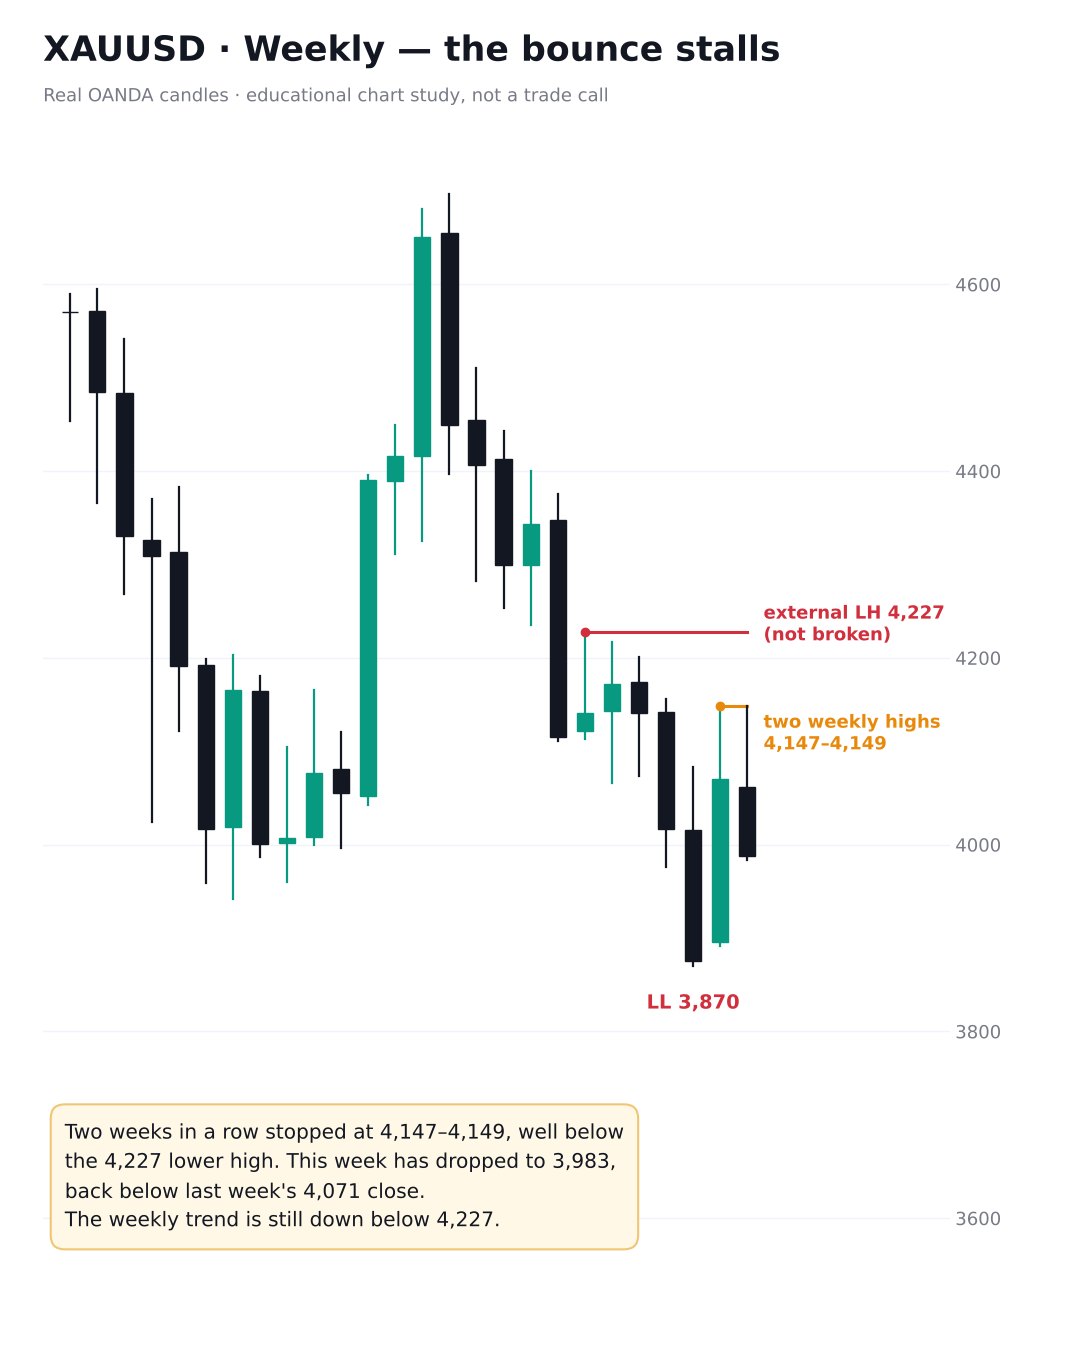
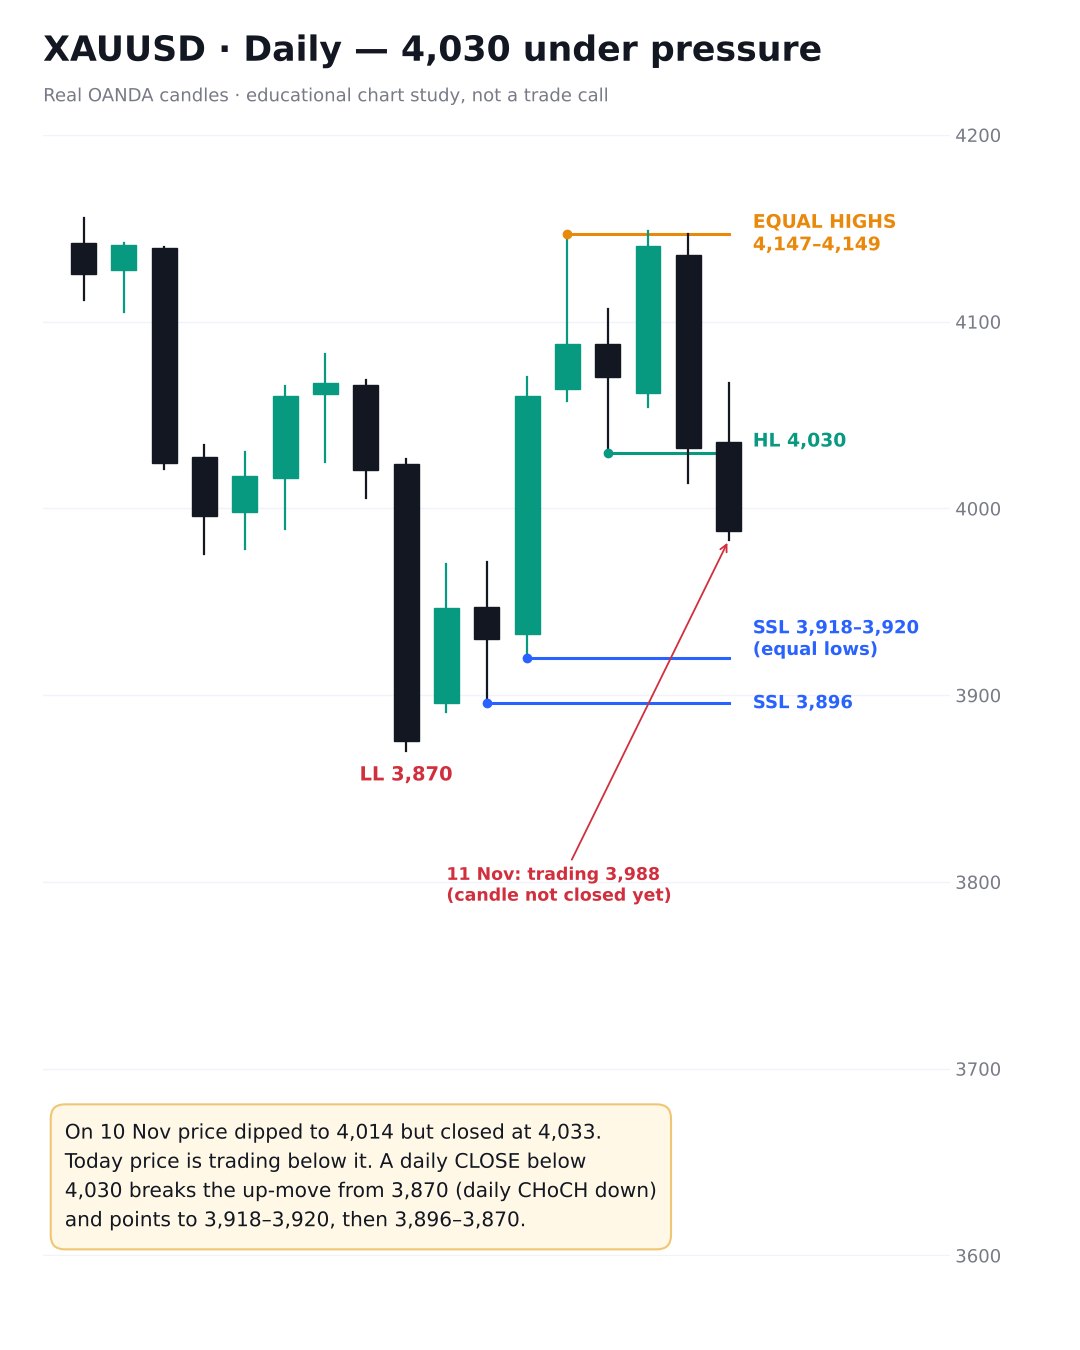
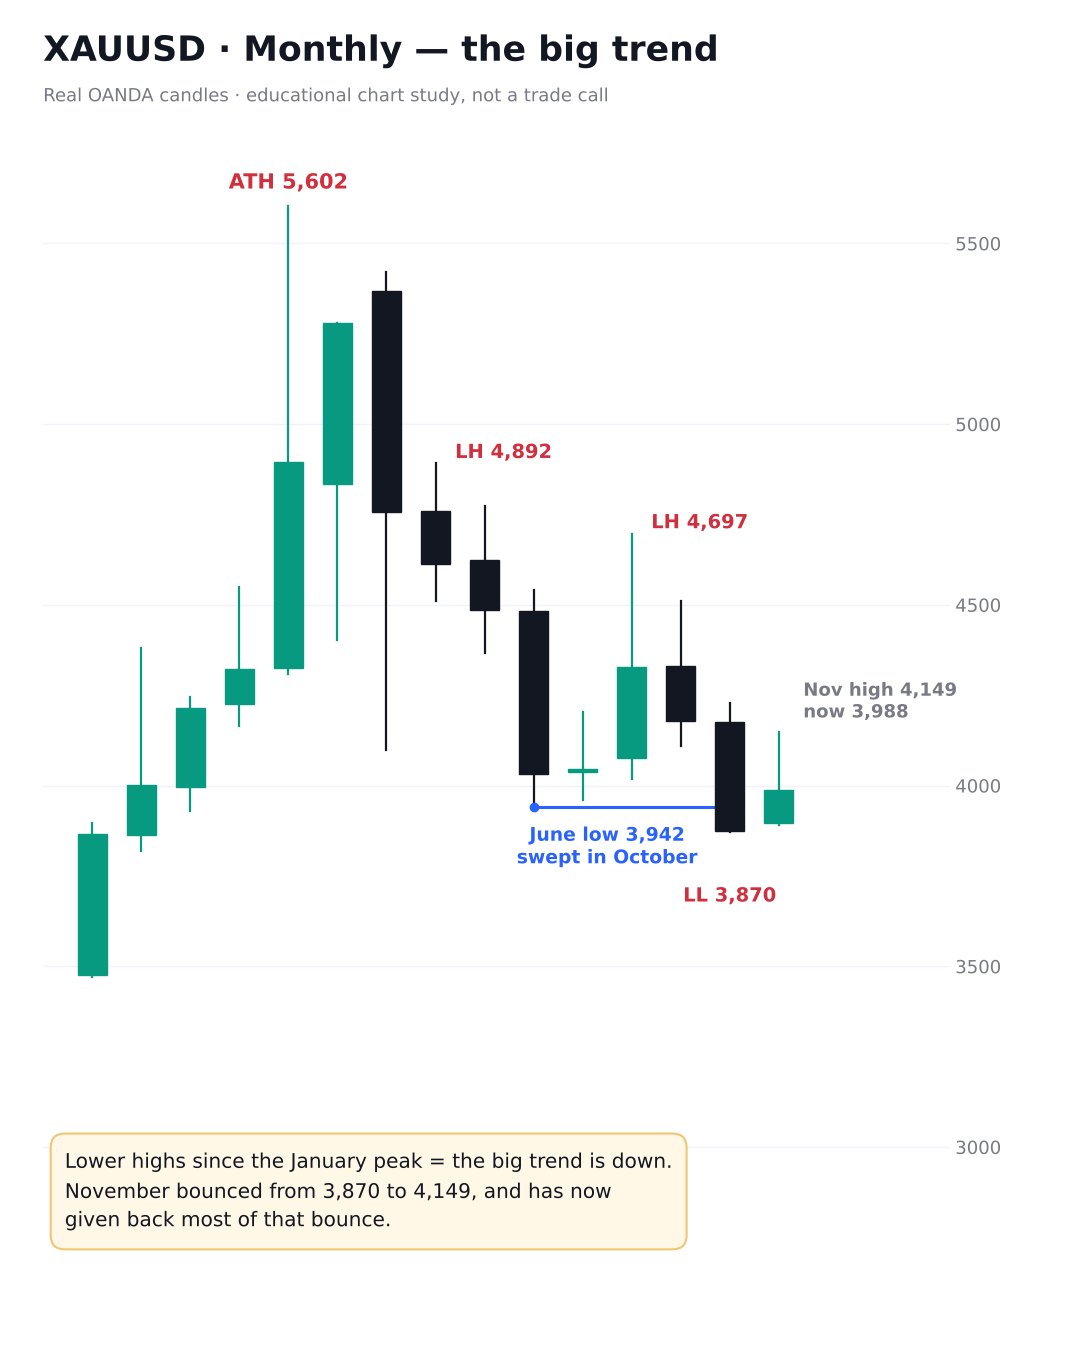
On the monthly and weekly charts gold is still in a down trend: lower highs since the 5,602 January peak and two weekly highs that stalled at 4,147–4,149, below the 4,227 lower high. On 11 November price fell back below the 4,030 daily higher low. The structure leans bearish while price stays below the H4 lower high at 4,067.
What are the key XAU/USD levels to watch?
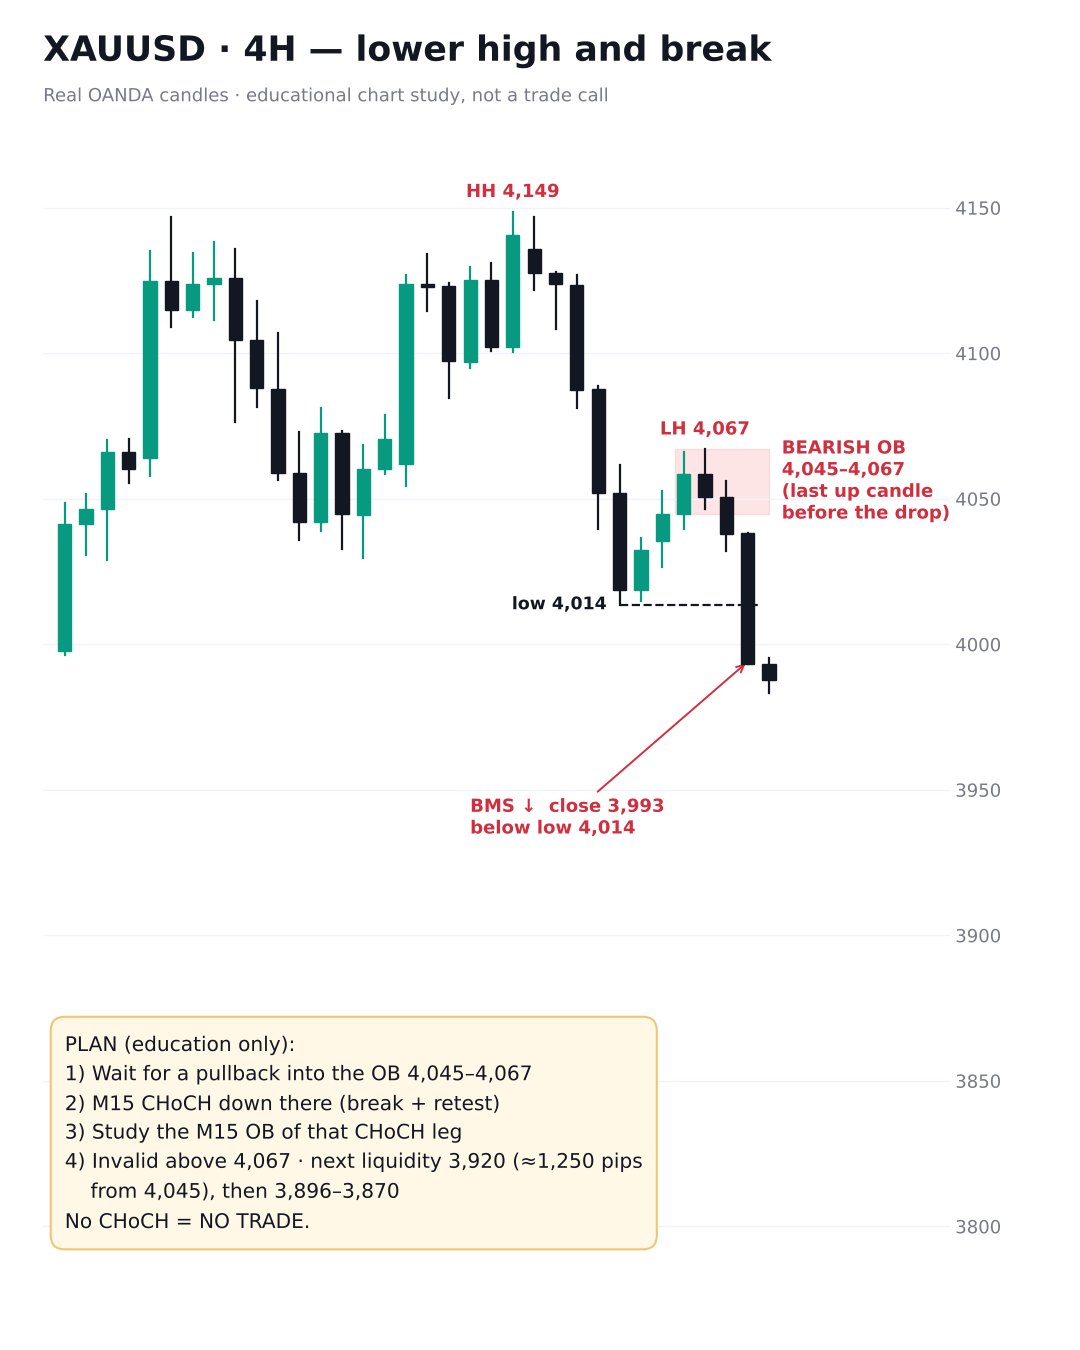
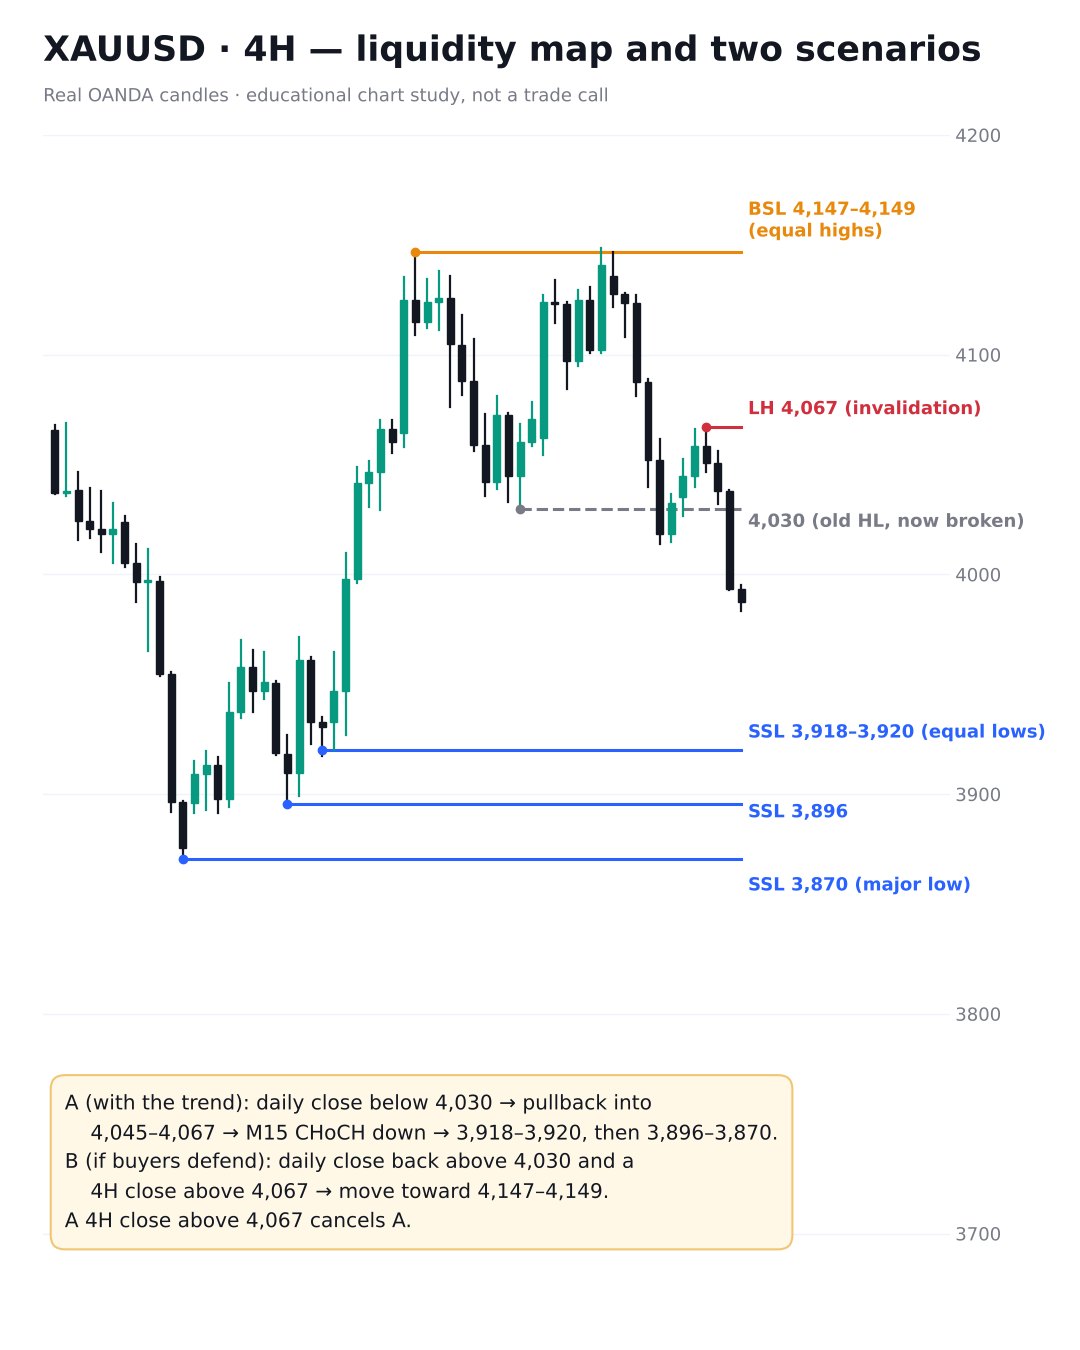
4,067 (H4 lower high and invalidation of the bearish idea), 4,045–4,067 (H4 bearish order block), 4,030 (the daily line), then sell-side liquidity at the 3,918–3,920 equal lows, 3,896 and the 3,870 major low. Above, buy-side liquidity rests over 4,147–4,149.
What happened to the 10 November plan?
Price never pulled back into the 4,102–4,149 order block; the highest it reached was 4,067. It fell to 4,030 and below without that pullback, so by our rules there was no setup. We do not chase a move that skipped the zone.
What would cancel the bearish scenario?
An H4 candle closing above 4,067. A daily close back above 4,030 would also weaken it and bring the 4,147–4,149 highs back into play.
Is this a trade signal?
No. This is an educational study of market structure. It is not a trade call or a recommendation to buy or sell, and levels can be invalid by the time you read this.