Gold bounced from 3,870 and stalled three times at 4,147–4,149. Today H4 structure turned down. From the monthly chart to the H4 liquidity map, here is what each timeframe shows and which levels decide the next move.
By XAU Setups Research Desk
10 November 2026
OANDA XAU/USD data
6 min read
Educational chart analysis only · not financial advice.This is a study of market structure for learning. It is not a trade call or a recommendation to buy or sell. Prices move fast; levels can be invalid by the time you read this.
Step 1 · Monthly
What is the big trend?
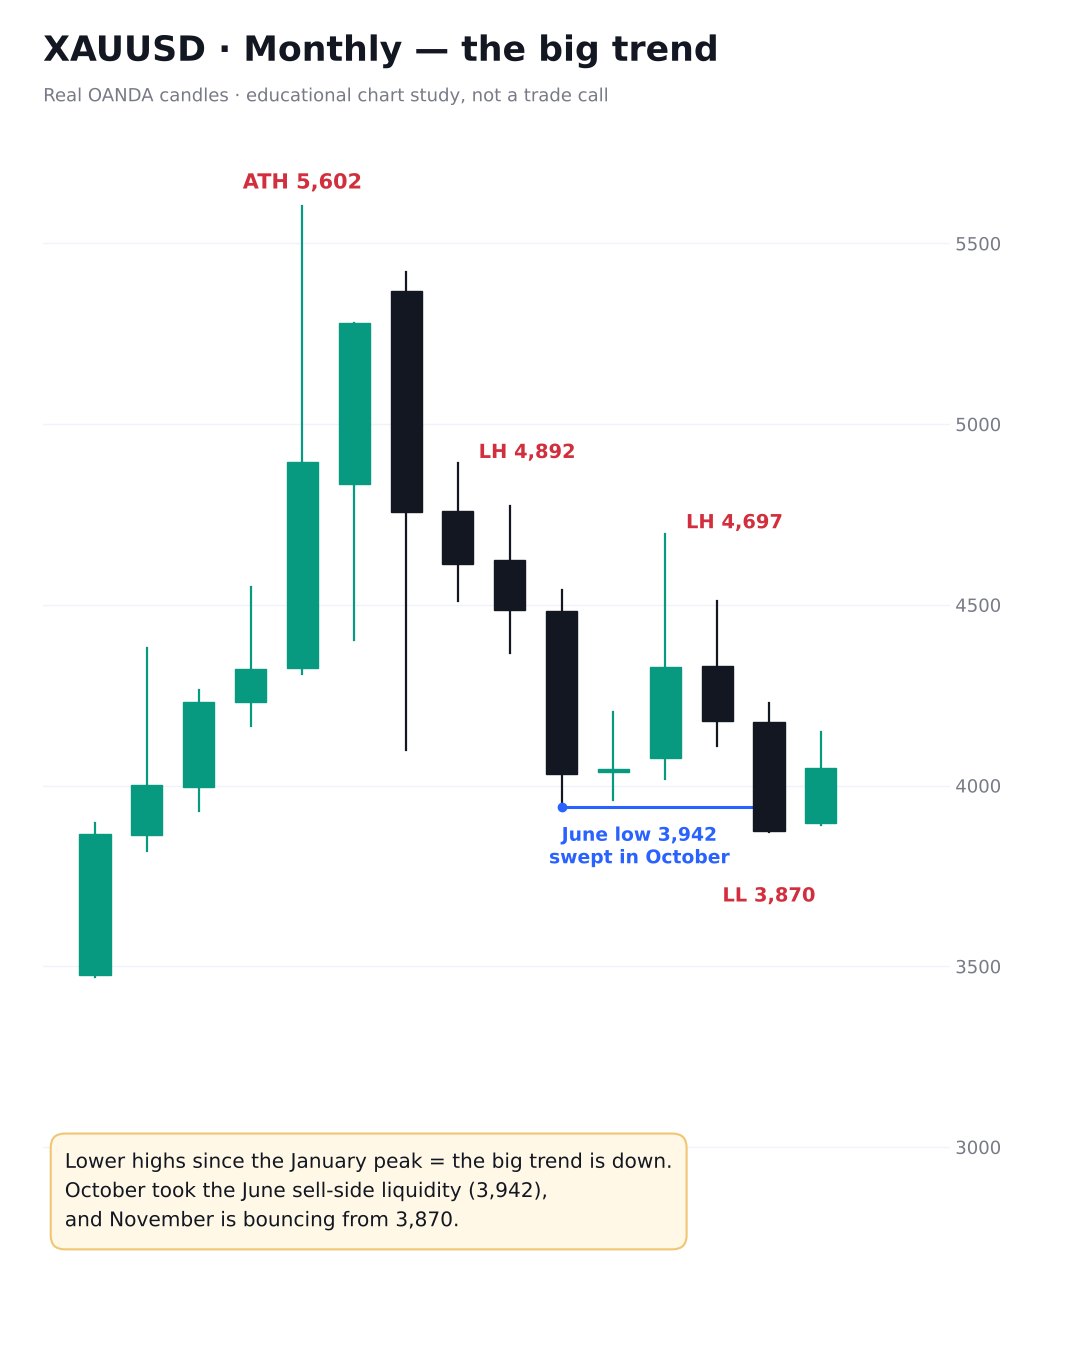
In January 2026 gold printed its highest high at 5,602.
Since then each high is lower than the last: 5,420 in March, 4,892 in April and 4,697 in August.
In October price traded below the June low of 3,942, took the stops resting there, and made a low at 3,870.
November so far is a bounce: the month opened near 3,896 and has traded as high as 4,149.
What it means: The big trend is still down. After the June liquidity was taken, a bounce was the expected first move, and that is what November shows so far.
Step 2 · Weekly
This week's bias
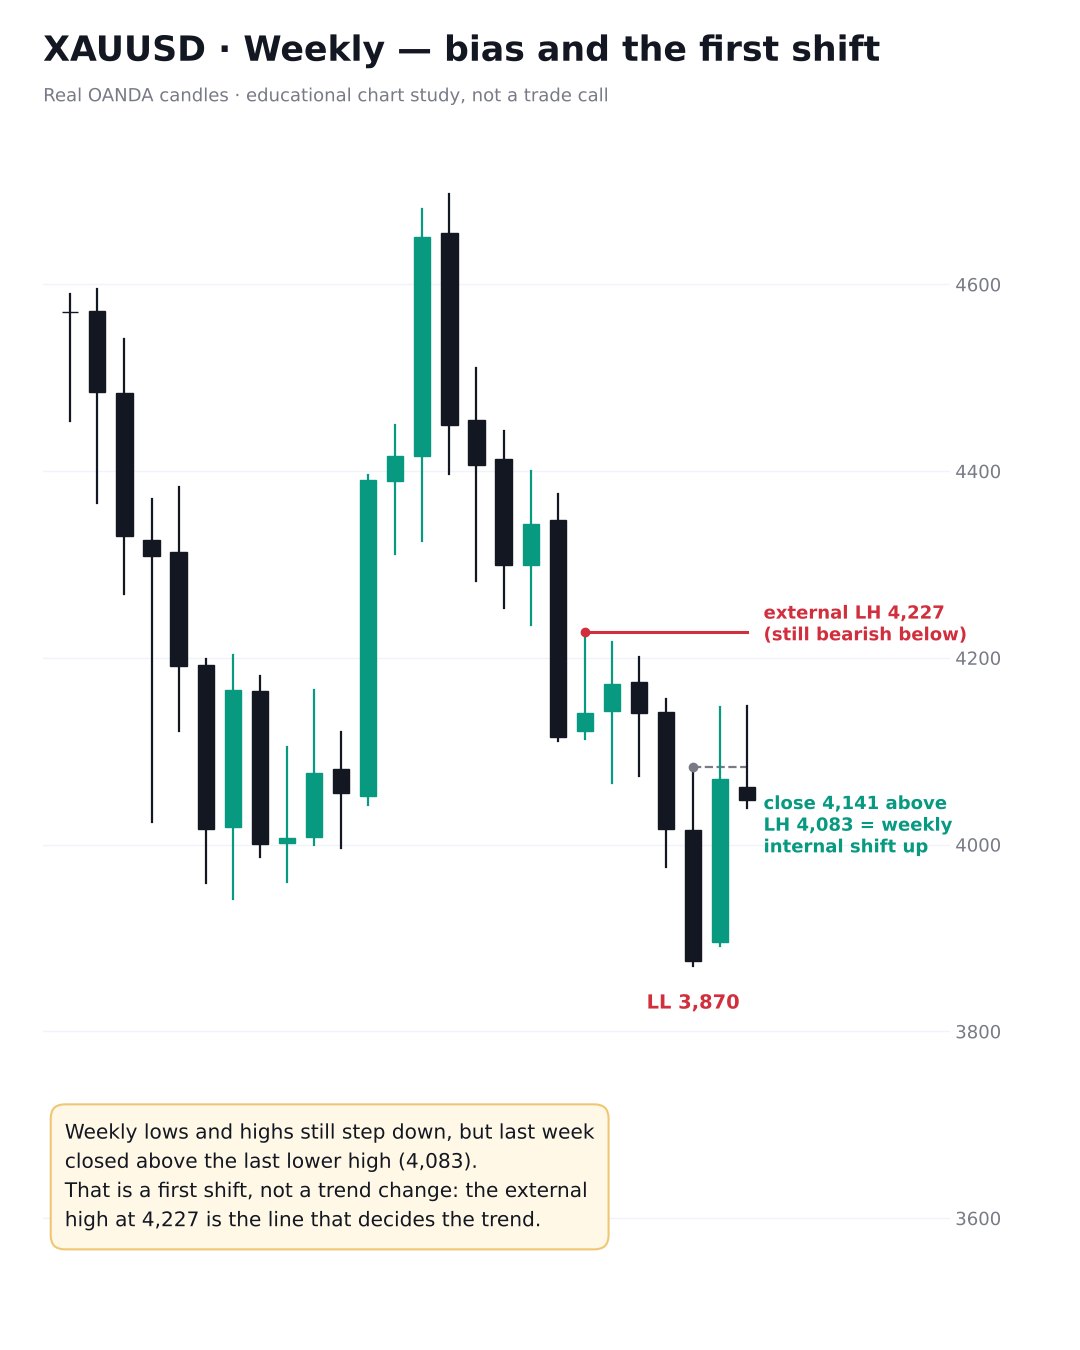
The weekly highs stepped down for five weeks: 4,227, 4,217, 4,201, 4,156 and 4,083.
Last week closed at 4,141, above the last lower high at 4,083. That is a first shift inside the range.
The bigger lower high at 4,227 has not been broken, so the weekly trend has not changed yet.
This week opened near 4,136 and dropped to 4,040 today (around 4,048 at the time of writing).
What it means: The weekly bias is mixed: a short-term shift up inside a bigger down trend. Above 4,227 the picture would change; below 3,870 the down trend continues.
Step 3 · Daily
Where is the liquidity on the daily?
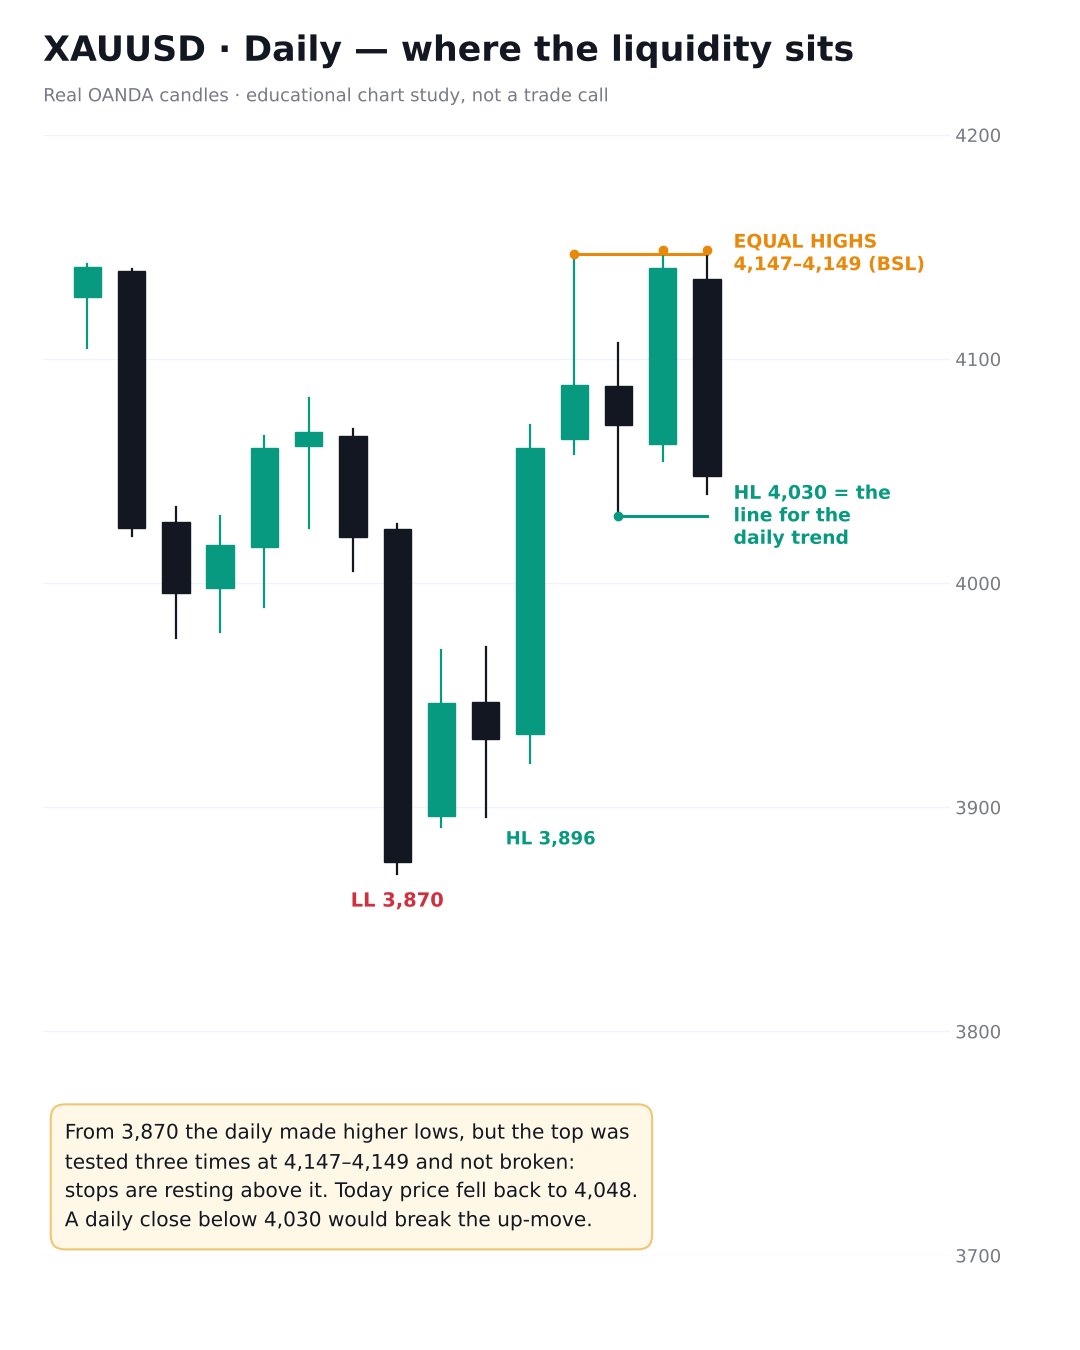
From the 3,870 low the daily made higher lows at 3,896 (3 Nov) and 4,030 (6 Nov).
The top was tested three times at 4,147–4,149 (5, 9 and 10 Nov) and not broken. Equal highs like these leave buy stops resting above them (buy-side liquidity).
Today price fell to 4,040, below the 9 Nov low, but it has not traded below 4,030.
What it means: The line for the daily up-move is 4,030. A daily close below it breaks the up-move and points to the sell-side liquidity at 3,896 and 3,870. While it holds, the equal highs at 4,147–4,149 stay the obvious target for buyers.
Step 4 · H4 structure
What did structure confirm today?
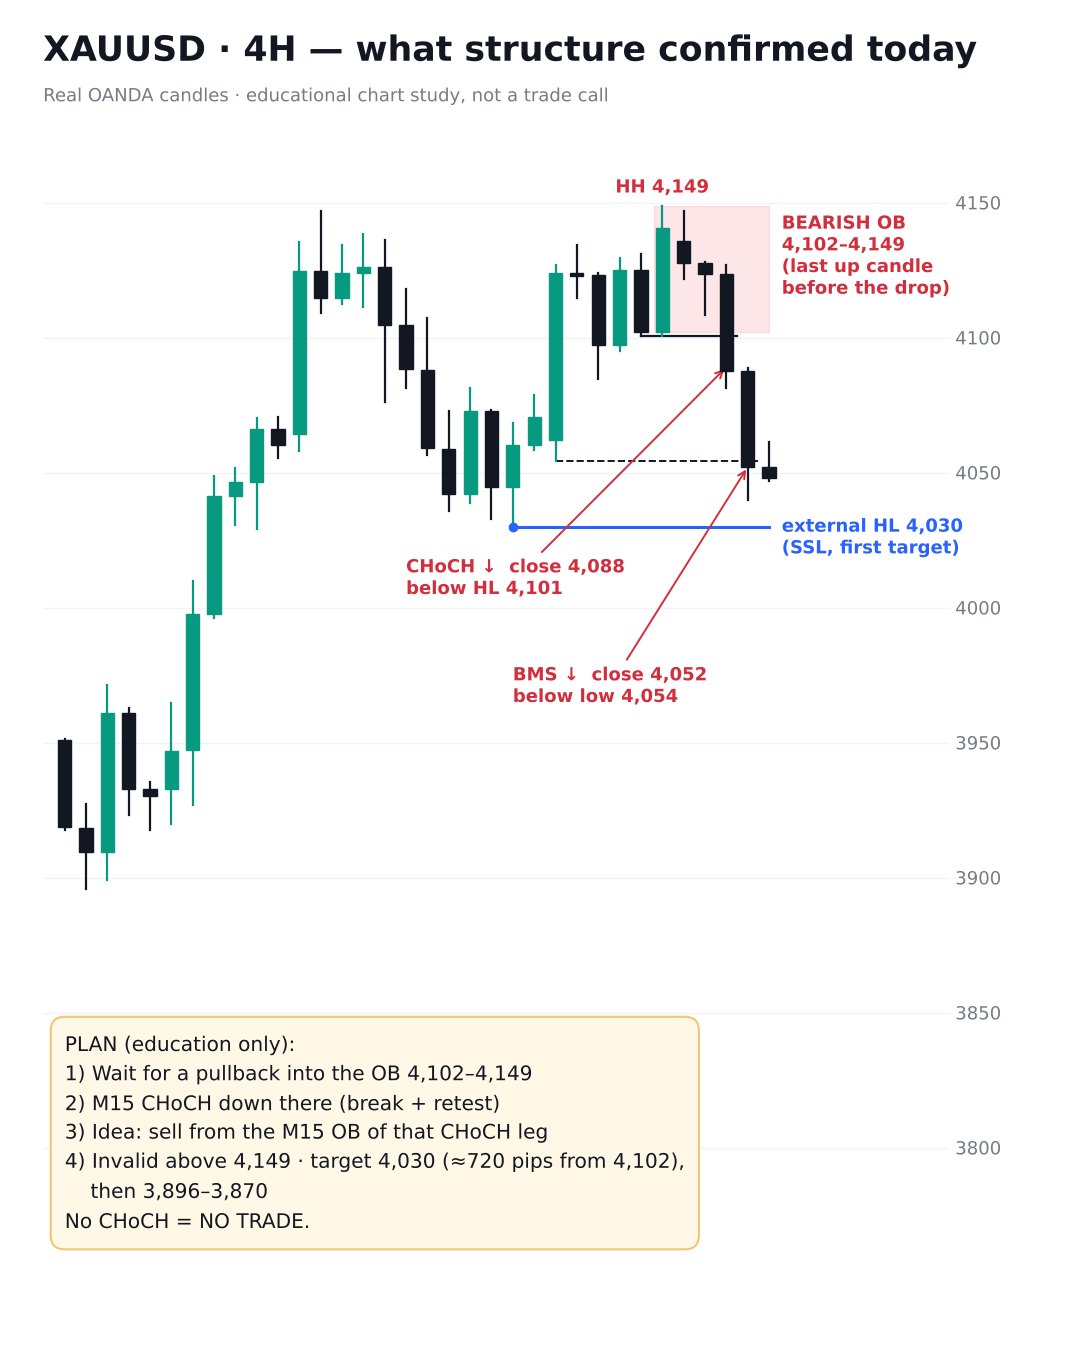
The last H4 higher low before the 4,149 high was 4,101 (9 Nov).
Today the 06:00 UTC candle closed at 4,088, below that low. That is a change of character (CHoCH) to the downside.
The next candle closed at 4,052, below the 4,054 swing low: a break of structure (BMS) that confirms the move.
The last up candle before the drop leaves a bearish order block at 4,102–4,149.
What it means: H4 has turned down inside the daily range. The zone to study for a bearish reaction is the order block at 4,102–4,149, and the first liquidity below is 4,030.
Step 5 · H4 liquidity
Where is the liquidity, and what are the two scenarios?
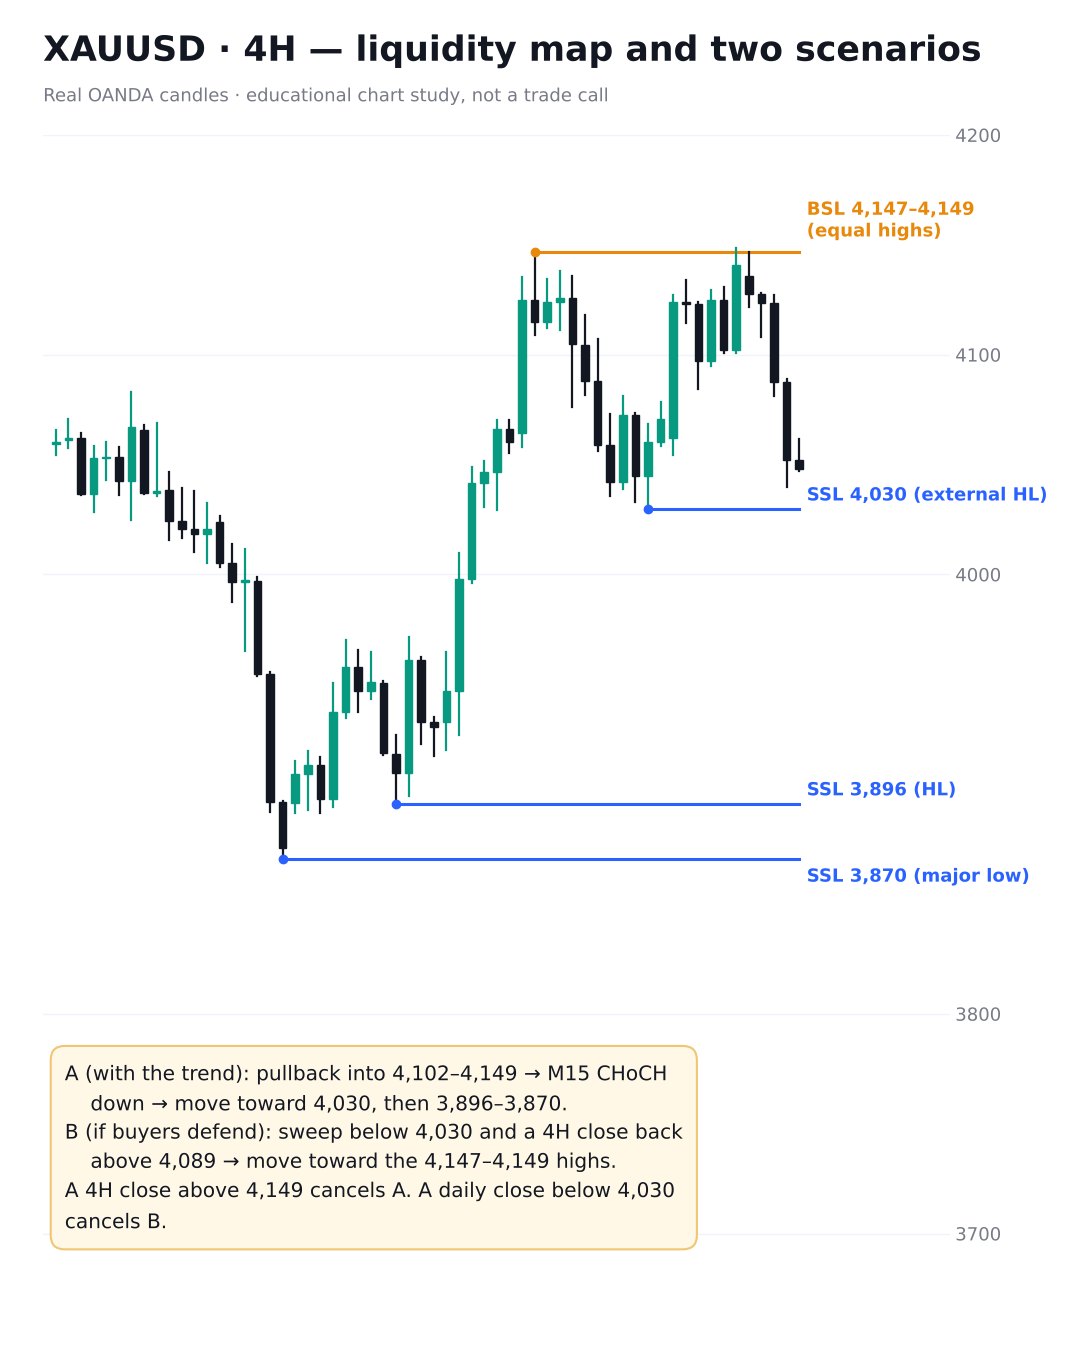
Buy-side liquidity (BSL): above the equal highs at 4,147–4,149.
Sell-side liquidity (SSL): 4,030 (the external higher low), then 3,896 and 3,870.
Scenario A (with today’s H4 shift): a pullback into 4,102–4,149, then an M15 CHoCH down on a candle close. The draw would then be 4,030 (about 720 pips from 4,102), then 3,896–3,870.
Scenario B (buyers defend): a sweep below 4,030 that closes back above it, then an H4 close back above 4,089. The draw would then be the 4,147–4,149 highs.
What it means: A 4H close above 4,149 cancels Scenario A. A daily close below 4,030 cancels Scenario B. Between the two, in the middle of the range, there is nothing to act on.
Summary
What we are watching
Higher-timeframe trend
Down on the monthly; mixed on the weekly (shift above 4,083, but below 4,227)
Daily line
4,030. A daily close below it breaks the up-move from 3,870
H4 today
CHoCH down (close 4,088 below the 4,101 higher low), then BMS below 4,054
1. Wait for
A pullback into the H4 order block at 4,102–4,149
2. Confirmation
An M15 change of character to the downside, on a candle close
3. Zone to study
The M15 order block of that CHoCH leg
Invalidation idea
Above 4,149
Liquidity below
4,030, then 3,896 and 3,870
Scenario cancelled
An H4 candle closes above 4,149
No CHoCH means no setup. If price falls straight to 4,030 without a pullback, we do not chase it; we wait to see whether 4,030 holds or breaks on a daily close.
Educational chart analysis only · not financial advice. This analysis is for education only. It is not a trade call, and past structure does not guarantee future price. Trading gold on margin carries a high risk of loss.